
Psychological assessments predict work-related behavior. With evidence-based predictions, you prevent wrong choices, anticipate better, develop in a targeted way, and combine the right people in teams. Thus, you save time in recovery afterwards and accelerate with less turnover, more quality, targeted development and more effective teams.

All our assessments are conducted by psychologists NIP (psynip.nl), in accordance with the Professional Code of Conduct 2024. We combine professional expertise with evidence-based, reliable, and valid instruments, assessed in accordance with the EFPA Test Review Model. This creates a solid foundation of quality and respect.
Our data go beyond individual scores. We translate psychological measurements into team and organizational insights and substantiate policy with hard facts. In doing so, we map not only what someone can do now, but also how growth and future skills will be realized.
Psychological insights and data translate directly into stronger teams, agile organizations, and targeted leadership development. From our field, we help organizations compete, accelerate,e and anticipate the future, with growth that is sustainable and impactful.

Investing in assessments sometimes feels like an extra step in your process. But the facts are clear: assessments pay for themselves faster than you think.
A wrong hire can quickly cost tens of thousands of dollars. Assessments reduce that risk. They have a higher predictive value than resumes or separate interviews. An increase in validity immediately increases the proportion of successful hires. As a result, you make fewer costly mistakes, and the damage is limited. Research shows that better selection procedures generate millions in additional output per year.
Turnover is a silent cost. When people leave, they take their knowledge with them, creating an empty space behind. With assessments, you increase the chances that someone will really fit in, land better, and stay longer. Fewer mismatches means fewer early departures. The team becomes more stable, and you notice that immediately in motivation, cooperation, pace, and productivity.
The difference between average and strong performers is significant. The value of that difference is at least 40% of an annual salary. With better selection, you are more likely to find the high performers. Those deliver more output, pull others up with them, and increase the team’s productivity.
In a rapidly changing marketplace, every month counts. Assessments predict not only performance, but also learning capacity. That shortens onboarding time and makes your organization more agile. New employees add value faster, so you see results sooner.
Easily calculate the added value. Enter your figures. Click on calculate and you're done..
The ROI calculator is based on the Brogden-Cronbach-Gleser (BCG) model.
A number of variables determine the outcome of the math:
The average annual salary of the position. The SDy: which is the estimate of the difference in value between average and strong performers. For this, conservatively calculate with 40% of the salary.
Then, the validity of your old method (r₀) and the validity of the new method (r₁). We call the difference between them Δr. Then you have the number of hires per year (N), the average time in position (T), and the total cost of the assessment program (C).
The math is simple:
Additional value per hire per year = Δr × SDy.
Total value = (Δr × SDy) × N × T.
Net revenue = Total value – cost.
Suppose an employee earns an average of €60,000. Then SDy is 40% of that: €24,000. Your current method has a validity of 0.10 and with assessments this rises to 0.50. Thus, the profit (Δr) is 0.40.
With 30 hires per year, an average job duration of 3 years, and €24,000 in costs, the arithmetic yields the following:
Additional value per hire per year = 0.40 × €24,000 = €9,600.
Total value = €9,600 × 30 × 3 = €864,000.
Net revenue = €864,000 – €24,000 = €840,000.
In plain language: by using assessments, you are more likely to select the right people. Over three years, that will yield €840,000 in net benefits.
Take a salary of €75,000. SDy then becomes €30,000. The old method scores 0.15, the new 0.60. Δr = 0.45.
With 50 hires per year, an average job duration of 3 years, and €50,000 in costs, the calculation looks like this:
Additional value per hire per year = 0.45 × €30,000 = €13,500.
Total value = €13,500 × 50 × 3 = €2,025,000.
Net revenue = €2,025,000 – €50,000 = €1,975,000.
In short, the greater the differences in performance within a function, the greater the benefit of better selection. The investment pays off handsomely.
Objective selection, fewer mis-hires and 40% less early attrition.
Visualize skills, talent and development potential for sustainable employability.
Develop agile leaders and strengthen succession planning.
Minimize strategic risk in top selections.
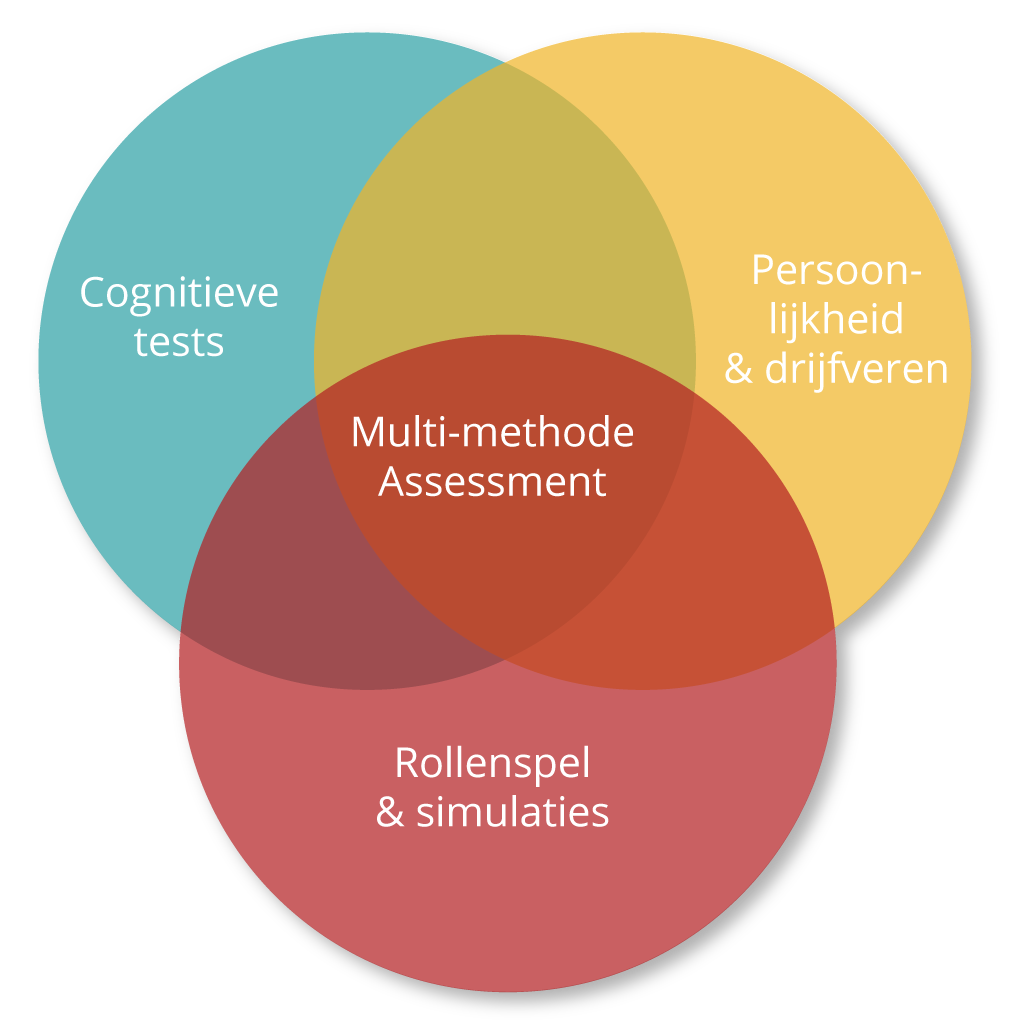
Our assessments are multi-method: we combine cognitive ability tests, personality questionnaires, motivational questionnaires, measures of frustration tolerance, structured interviews, and practice simulations.
This combination provides insight into what a person can do, how they behave, what motivates them, and how they handle pressure and adversity.
By combining, our multi-method approach yields a validity of 0.65-0.70.
| Combination | Combined validity (r) | Reliability |
|---|---|---|
| Cognitive ability + structured interview | 0,65 | High |
| Cognitive ability + personality + drives + integrity + interview + simulations | 0,65-0,70 | High; generalizable reliability 0.70-0.80 |
Our assessments fully comply with AVG/GDPR and the NIP Code of Confidentiality and Reporting.
Candidates receive transparent information, perusal rights and we only report to third parties with explicit consent.
Our instruments have been assessed for reliability, validity, standardization and fairness.
As an organization, that gives you comparable and defensible outcomes in selection and development.
Many talent decisions are still made based on impressions. That feels convincing, but unfortunately, intuitive choices rarely predict performance.
With objective assessments, you make a difference.
Our multi-method assessments, including measures of drives and frustration tolerance, increase the predictive value to 0.65-0.70, with better selection, fewer mis-hires, and higher retention.
In short: gut feeling is human, but psychology and data bring decisions that actually lead to growth.
Schedule an introduction or demo today and discover the impact of predictive data and psychological insights.

This fact sheet provides an overview of the most commonly used (psychological) selection methods, both classical and modern. The figures are based on meta-analyses and dominant scientific literature.
| Method | Predictive validity (r) | Typical reliability |
|---|---|---|
| Cognitive ability (GMA test) | .51 | High (.85-.95) |
| Work test | .54 | High (inter-rater ≥.70) |
| Structured interview | .51 | Medium-high (.60-.75) |
| Unstructured interview | .18-.38 | Low-medium (.40-.55) |
| Integrity test | .41 | High (α ≥.80) |
| Conscientiousness (Big Five) | .31 | Medium-high (α ~.75-.85) |
| Job knowledge test | .48 | High (≥.80) |
| Years of service | .18 | Not applicable |
| Video/asynchronous interview (incl. AI) | .30-.40 | Good at structuring; algorithmically variable |
| Machine learning / algorithmic models | .20-.50 | Depends on dataset; generalizability limited |
| Serious games / game-based work samples | .35-.50 | High on objective metrics |
| Social media screening | .00-.20 | Low and variable |
Call directly:
+31 88 277 377 6